Call Detail Record - CDR
CDR
CDR shows all saved and finished calls in the database cdr table. The CDR main window is divided to the CDR list and Dashboard at the bottom. Dashboard can be resize or hiden.
CDR list window
Title bar
CDR list starts with Title bar where the usercan quickly filter calls based on date range. (please note that this date range will not be active if you disabled it in user preferences).
Button panel
Below the CDR title is the button panel where you can list through CDR pages and access filters and other features
Filter Form button
clicking on Filter Form button shows an advanced Search form with two tabs on top - “common” and “RTP”. All search parameters can be saved as a template for repetitive usage which you can find under the quick filters button.
Common tab
- Date range filters CDR based on Date and/or Hour/Minute criteria.
- Caller called number or name or domain can be filtered for a specific number/string or for specific prefix “222%” or specific suffix “%222”. (please note that searching for a suffix uses reversed column with the index and is as fast as searching for a prefix). You can also search only for the caller or only for the called number clicking on the arrow and selecting Caller num. You can also combine searching by “,” and use negation – 222%, 223%, !2232% - this example means search calls starting with 222 or 223 but not starting with 2232.
- Caller or called group can be used for searching for specific list of numbers. You can manage groups directly by clicking on the group icon.
- Caller or Called domain searches CDR by @domain. The domain is taken from "From" SIP header.
- Caller name searches by caller name part
- Caller or Called IP – use single IP address or specific network like 192.168.0.0/24. CDR is filtered by SIP IP signalization.
- Caller or Called IP group can be used for searching for specific list of IP. You can manage groups directly by clicking on the group icon.
- Codec searches calls by specific codecs where you can select multiple codecs.
- Call duration filters by specific duration interval (total call length including ringing).
- PDD - filters by Post Dial Delay range.
- Last SIP response code filters by SIP status codes (like 483, 503, 603 etc). To find all 4XX responses use 4% syntax.
- Direction (by trunk) – filters calls by direction IN, OUT or Internal. To define the direction you need to create an IP group and set a trunk check box on it.
- Internal calls are all which does not match the IP list of all Trunk IP groups.
- Interrupted call - check box finds all interrupted calls which are those without BYE or confirmation to BYE.
- SIP agent - filters SIP agent header. This header usually carries phone manufacturer/firmware version.
- RTP source IP – filters calls by RTP source IP addresses instead of SIP IP addresses.
- Call ID filters SIP Call-ID header which is a unique string. This string also names pcap files.
- Sensor - you can filter CDR by specific sensor
RTP tab
RTP tab is used to filter calls by RTP metrics.
- RTCP Jitter – filters calls by the worst RTCP jitter value of both directions either by its MAX value or average value.
- RTCP fraction loss – filters calls by the worst RTCP fraction loss value of both directions either by its MAX value or average value.
- RTCP Fraction Lost Pkts – number of packets with non-zero fraction lost
- Last RTP from last SIP – seconds between last RTP and last SIP packet
- MOS – filters all calls which have MOS lower than entered value.
- PDF – Search calls by PDV intervals. To find the worst calls use PDV intervals >120 for at least 10 occurrences.
- strict – ON is searching for exact match, all conditions must be satisfied in all PDF fields. e.g. value 2 in field >50 and value 7 in field >90 and value 10 in field >300 mean that the call must hit two or more of >50ms delayed packets AND seven or more of >90ms delayed packets AND ten or more of >300ms delayed packets. OFF is searching for any delayed packets greater then the summed value. e.g. you must hit ten or more of >300ms delayed packets OR hit seven or more of >300ms delayed packets + >90ms delayed packets OR hit two or more of >300ms delayed packets + >90ms delayed packets + >50ms delayed packets.
- Loss – Search calls by number of consecutive loss. Number 1 represents the number of single packet occurrences, number 2 is the number of times two consecutive packets have been lost, ..., number 10 is the number of times more than 10 consecutive packets have been lost.
- strict – ON is searching for exact match, all conditions must be satisfied in all loss fields. e.g. value 2 in field 1 and value 7 in field 5 and value 10 in field 9 mean that the call must hit one lost packet in a row twice or more AND five lost packets in a row seventimes or more AND nine lost packets in a row tentimes or more. OFF is searching for any loss greater then the summed value. e.g. you must hit one lost packet in a row twice or more OR hit 5* five lost packets in a row + one lost packet in a row >= 7 OR hit 9* nine lost packets in a row + 5* five lost packets in a row + one lost packet in a row >= 10.
- Silence – search for calls where there was specified % of silence audio frames. The silence detection must be enabled in the sniffer configuration silencedetect = yes.
- Last Silence [s] – search for calls where there was silence at the end of calls for specified seconds. This is usefull when you want to search calls where audio was cut (silence) - the silence is meant by silence in audio and not missing RTP frames. This feature must be enabled in the sniffer also.
- Clipped Frames – number of clipped audio frames (usually one RTP packet is 20ms audio). This can happen when one side speeks too loud for example or on broken devices / transcoders etc. This feature must be enabled in the sniffer also.
Quick filters button
used to find the worst calls by Loss, Delay or combination of that two (MOS). Here is also saved filter form templates (at the bottom of menu. If no filter templates exists there is no items in this menu).
Order current data will order the current filtered CDR by Loss, Delay or MOS score. Last 24 hours, 7 days, 30 days and year will order by worst Loss, Delay or MOS score. Keep in mind that ordering millions of CDR (month or year) can take a lot of time.
Reset filter button
This button resets search criteria to default values.
Menu button
Under the Menu button areDelete and Export CSV. Delete allows the user to delete CDR records and files either for all current filtered CDRs or only for selected filters (you can select several CDR by holding CTRL+mouse click).
Charts button
Activates small window with charts which is used to add charts to current data. Charts are described in detail in chapter -> Charts.
- Undock button detaches chart window to float window
- Close button hides charts window
- Add chart button shows a chart form for adding graph
Right upper corner icons
- Saves graph as SVG or as PDF*Modifies created graph
- Creates new internal ticket with chart image*Removes graph
CDR column headers
Column headers contains quick filters and some are sortable. Some of the columns may be hidden or reordered by dragging it.
CDR row
The CDR row contains these columns
- ID – Each CDR is assigned a new, unique, consecutive number.
- sensor id - name of sensor which created the CDR. It can be blank (if id_sensor is not set in sniffer)
- Datetime – is start of the call
- Duration (PDD)/Codec – shows Duration of call, PDD and codec used.
- Call num/name, SIP source IP, SIP agent shows information identifying caller.
- Called num, SIP destination IP, SIP agent shows information identifying callee. The red icon in those columns signalize which side sends BYE first.
- Last response – shows number and full text of the last SIP response. For connected calls it shows 200 OK.
- Column Caller/Called RTP shows the source IP address of Caller/Called RTP stream. The IP address represents SOURCE IP of Caller or Called RTP stream.
 MOS Score row shows MOS score for three type of jitterbuffer – fixed 50, fixed 200 and adaptive 500.
 Delay distribution shows all PDV intervals colored accordingly. Left number is 50 – 70ms interval and has green color. The most right number is PDV interval >300ms and has red color.
 Loss distribution shows all loss intervals colored accordingly. The green number on the left represents occurrences of one consecutive loss. The red number on the right represents occurrences of more than ten consecutive losses.
 RTCP part (if RTCP packet was captured) shows MAX RTP jitter (J:26.3) and MAX RTCP fraction loss (L:72.3). RTCP in Caller column shows how called side sees the stream.
 Commands shows two links and one flash-based WAV player. PCAP will download PCAP file and WAV link will download audio file.Play button starts playing directly in web browser (the flash plugin must be installed).
MOS / loss / delay numbers are also in CDR detail
CDR detail
Clicking on [+] shows the full details of the CDR with extended information.
The detail area starts with tabs – the first one is a summary, next is SIP: history followed by Legs by CID and Legs by header.
Summary
The first table shows SIP signalization information like call start, duration, PDD time, ringing time and connected time, last SIP reposne, caller and called information. Under this table bigger WAV player is shown. The next table shows RTP statistics, PDV intervals and loss intervals. Avg compressed jitter represents PDV where number 1 is no jitter (or very little). A higher number represents higher jitter. Max compressed jitter shows the maximum jitter during the call. This value is computed according to RTP RFC.
The last table Shows SIP messages chronologically. Each SIP message, when clicked, will display a new WINDOWwith full packet information with all protocols Ethernet – IP – UDP – SIP/RTP.
Graph
The graph section shows detailed delay and loss distribution. Clicking on the graph will open new window with the graph.
Audio wave is transformed into packets which are sampled every 20ms. Each packet is sent every 20ms and send over network. Packets can be delayed either positive or negative (delayd or sent inburst from some switch queue etc.). Those delays differences are measured by sniffer and it is called Packet Delay Variation (PDV) and it is also called jitter. Each delay difference is stored in .graph file which is used to draw graph showing all PDV. Every 20 packets are „compressed“ into single vertical line and the color dot represent median and packet loss (green is no packet loss).
Why is chart climbing where there is larger packet loss? Because if loss is not distributed randomly it can cause chart climbing up/down as you can see on this example:
Why is chart constantly climbing up or down although there is no packet loss? It is caused by clock drift between RTP sender and sniffer receiver.Some voip phones has internal clock not accurate and it compensate it after some time which results in chart looking like pillow.
SIP:history
SIP history tab shows SIP packets chronologically.
button bar
- Undock will detach SIP history panel to standalone window
- wireshark filter is display filter according to wireshark specification. You can filter out some messages etc.
- download pcap will download pcap file filtered with wireshark filter (if set)
diagram
Diagram shows chronologically SIP messages and RTP streams. Clicking on SIP or RTP stream shows detail packet window
messages
SIP messages shows chronologically SIP messages and RTP streams in text table. Clicking on SIP or RTP magnifier shows detail packet window.
Packet detail window
Packet detail window shows SIP messages in wireshark mode or RAW text mode. In wireshark mode you can click on Expand All or Expand SIP branch button which will expand wireshark mode branches.
Legs by CID
Legs by CID (CID is number part from the From tag - From: <sip:+42142958395@voipmonitor.org.de>;tag=99fc4be3) is a grid of CDR which matches by caller id number and start of the call + - 5 seconds (default - can be changed in Settings main menu section). This interval can be adjusted in the tool bar. The purpose of this grid is quick way of finding all calls which might belongs to the same call – for example if call is routed through asterisk and asterisk calls to hunt group VoIPmonitor creates for each leg CDR – Incoming leg and outgoing legs. To find both legs click on one of the call.
Legs by header
match_header
Legs by header is used to correlate all CDR by specific SIP header. For example if a call is forwarded between more SIP proxies/SBC (and Call-ID changes) voipmonitor creates for each leg one CDR. When you find one of the CDR and you would like to see all legs which belongs to this CDR you can use legs by header to find it. This needs to have special information in all calls which means you need to have it supported directly in your SIP proxies (adding SIP header to all legs).
Example - the original call (lets say from SIP trunk to your SIP proxy) has Call-ID = TP4D2OC4KRDL5F6V3LDC3L6DEM. Then a SIP proxy forwards the call to another proxy and changes Call-ID to 26c4480371f54e170ede2dcf1caf1599 but it copies the original Call-ID (TP4D2OC4KRDL5F6V3LDC3L6DEM) to special SIP header match_header (match_header can be any SIP header name which is configured in voipmonitor.conf, typical is in-reply-to header). This way legs by header feature can find all CDR including the original CDR.
Another case is when you have multiple sensors on each SIP proxy/SBC and all stores to one database. In this case there can be two CDR with the same Call-ID header which legs by header also consider in searching.
Here is example of 6 CDR (6 legs) which represents one call. Using legs by header on any of those CDR will show all 6 CDR.
+----------------------------------+-----------------------------------------+
| call-id                          | match_header                            |
+----------------------------------+-----------------------------------------+
| 26c4480371f54e170ede2dcf1caf1599 | TP4D2OC4KRDL5F6V3LDC3L6DEM@81.201.83.45 |
| 4b07692c119f643119997e5833e9fe83 | TP4D2OC4KRDL5F6V3LDC3L6DEM@81.201.83.45 |
| 5b800a5c5e86d12833fe44ec4eac4ae8 | TP4D2OC4KRDL5F6V3LDC3L6DEM@81.201.83.45 |
| TP4D2OC4KRDL5F6V3LDC3L6DEM       | NULL                                    |
| 5b800a5c5e86d12833fe44ec4eac4ae8 | NULL                                    |
| 5b800a5c5e86d12833fe44ec4eac4ae8 | NULL                                    |
+----------------------------------+-----------------------------------------+
custom header
Another way how to pair CDR is to use sniffer feature Sniffer_configuration#custom_headers and WEB GUI Settings#CDR_Custom_header. Practical example is when you have two legs for one call - from your phone to SBC and from SBC to sip provider and you decide that you will put for both legs one unique identifier so both legs will have same string in some custom named header.
MySQL search
Legs by CID and Legs by header is also able to search in remote MySQL databases. To enable this feature create sensors in Tools -> Sensors section.
Charts
Charts are set of predefined charts and custom charts which is immediately applied to selected CDR by caller or called number or SIP/RTP ip address. The purpose of those charts (which can be plotted also in main menu charts section) is to quickly overview trends for the selected CDR. You can modify or create your own predefined types of charts in Settings -> CDR charts. Each rendered chart can be also tweaked by clicking on edit button.
- Interval - last, this hour, last 24 hours, last 2,3,7,30 days, ...
- filter - show graph for all CDR in Interval range which has the same caller, called, SIP/RTP destination or souce IP
- direction - plot data only for source or destination or both directions
- apply filter to parent table - after clicking on this button the current chart filter applies to the main CDR view.
loss ACD
This predefined chart shows average number of calls (gray bars) - values are on left Y axe, average packet loss distribution in % (red area) and ACD distribution - blue line (ACD values can be read only by hovering mouse)
#calls
Shows number of min/avg/max simultaneous calls (left Y axe) and total number of calls (gray right Y axe)
RTP statistics
Shows avg MOS score (green dots), avg packet loss (red area), avg PDV delay (magenta area)and avg number of calls (gray bars)
RTCP avg
Shows average RTCP jitter (magenta area), RTCP fraction loss (red area), MOS score (green line), number of calls (gray bars)
RTCP max
Shows maximum RTCP jitter (magenta area), RTCP fraction loss (red area), MOS score (green line), number of calls (gray bars)
PDD ASR SIP
Shows correlation between PDD (blue area) ASR (green line) and SIP 4XX response codes (red area). Here is example how high PDD causes increase of canceled calls
SIP
On this chart there are all SIP response codes stacked.
Codecs
Shows codec distribution
Filtered CDR
Shows all CDR which are filtered by the chart filter
map
Map tries to locate SIP src/dst IP addresses on google maps. You can choose from various public IP location services or you can download offline database (Settings -> Load GeoIP Data). For some geo location services you need to create or purchase key - maxmind.com and ipinfodb.com. Both keys are set in Settings -> system configuration -> GEOIP.
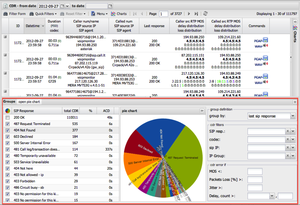
CDR group panel

CDR groups panel is divided into three sections. The left section shows grid of data related to chosen group. The middle section represents the grid data in a pie chart. The right section controls which data and how should be presented. The CDR groups panel is tight with the upper CDR view list – for example clicking on 200 OK SIP responses will filter all calls based on 200 OK reponess.
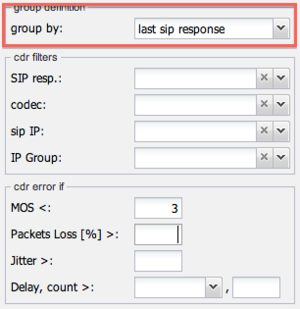
Group definition

Group By – choose which groups you would like to see. You can choose last sip response, Codecs, SIP IP or IP group which is group of IP addresses defined in Group main menu.
- ACD – The Average Call Duration (ACD) is calculated by taking the sum of billable seconds (billsec) of answered calls and dividing it by the number of these answered calls.
- ASR - The Answer-Seizure Ratio (ASR) is calculated by dividing the number of successfully answered calls by the total number of calls attempted, which are known as "seizures". 60-70% is considered a very good ASR in the VoIP world.
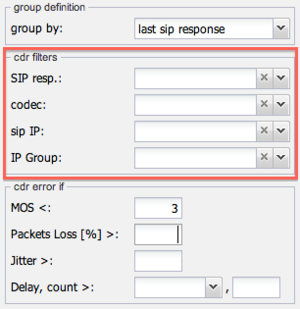
cdr filters

CDR filters can be used to filter CDR by SIP response, Codec, SIP IP and IP groups.
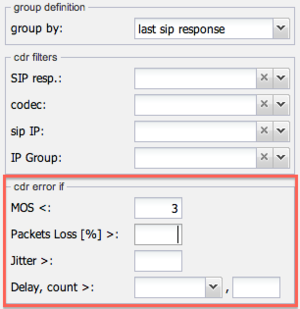
cdr error if

This section is used to show how many CDR are within set criteria. For example show how many CDR are below MOS score 3:


